☁ $PANW: Where's the Billings?
Answer: They're being financed
Disclosures: I do not currently have a position in PANW. None of this is investment advice and is solely my own views. Do you own due diligence.
LOTS of moving pieces in Palo's FCF Billings
Palo Alto has been the topic du jour over the past week as the company announced earnings with FY24 billings guidance missing consensus and guidance.
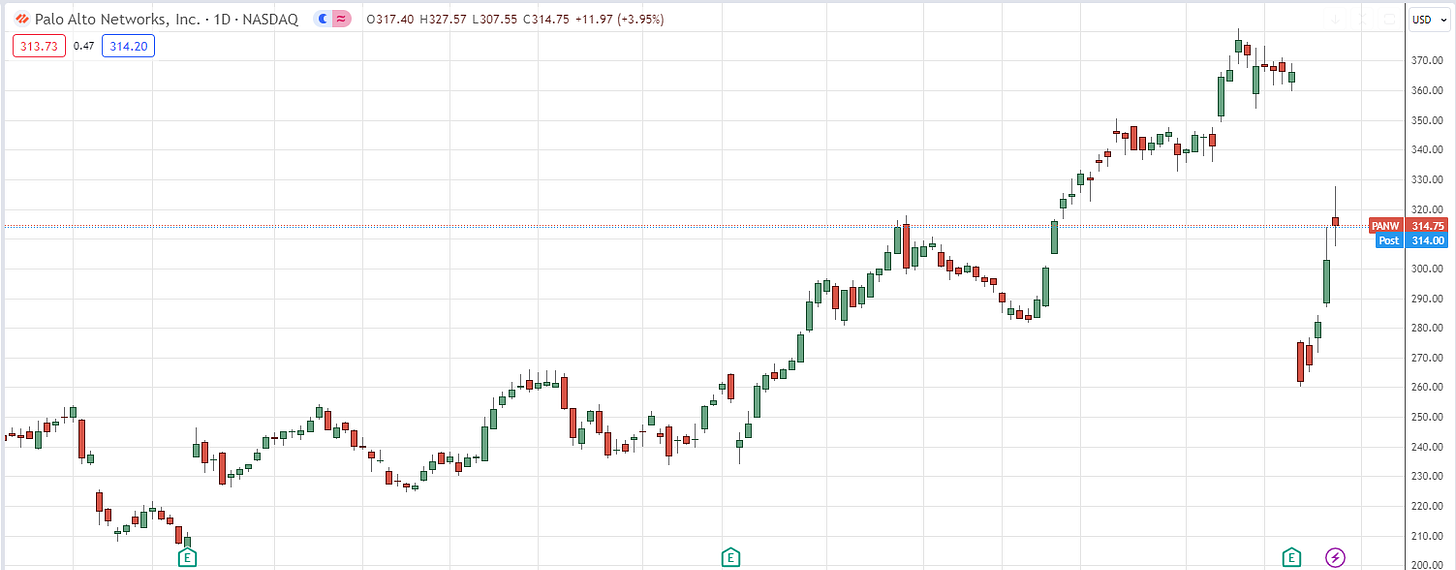
In response to the earnings report, the stock fell 25%+ (25-30bn mkt cap) as investors digested if “Platformization” is real or these declines represent organic headwinds.
With the guide lower, the majority of recent commentary has been focused on the company’s product strategy and industry competition, but I’ll be focusing on the key trends impacting Billings, Collections and FCF.
A major part of this is the company’s use of its relatively new Palo Alto Networks Financial Services (PANFS) which is captured as Financing Receivables on the balance sheet but generally lacks any other disclosures.
Note: I don’t touch on RPO trends and Revenue/Rev Rec which is another important part of this story
After all the chaos, PANW has partially recovered since sell side broadly supports the story and retail rushed in (led by none other than Nancy Pelosi).
FY24 Billings Guidance Missed Consensus and Guidance
Reports Q2:
Revenue $1.98B vs $1.97B Cons/Guidance
Billings $2.35B vs $2.36B Cons/Guidance vs. ~$2.40 buyside
Q3 Guidance:
Revenue $1.95-1.98B vs $2.04B Cons
Billings $2.30-2.35B vs $2.62B Cons vs. ~$2.63B buyside
FY Guidance (Jul 2024):
Revenue $7.95-8.00B vs prior guidance $8.15-8.20B and $8.19B Cons
Billings $10.10-10.20B vs prior guidance $10.7-10.8B and $10.74B Cons and ~$11B buyside
More analysis below 👇
☁ Bootcamp for SaaS Investors - Starting in ONE WEEK!
If you’re passionate about SaaS metrics and love diving into Cybersecurity companies like Palo Alto, you’ll love the interactive workshop!
🤑 Workshop starts next week and I included a special $100 off below!
Dive into SaaS ARR & revenue metrics (long-term FCF margins, Bookings, billings, and collections)
Co-hosted with Francis (Software Analyst) a guru in Cybersecurity who will help you with frameworks and diving into top public companies
Join students from Goldman Sachs, Microsoft, Bank of America, Palo Alto Networks, Cowen, SVB, Scotiabank, and VCs
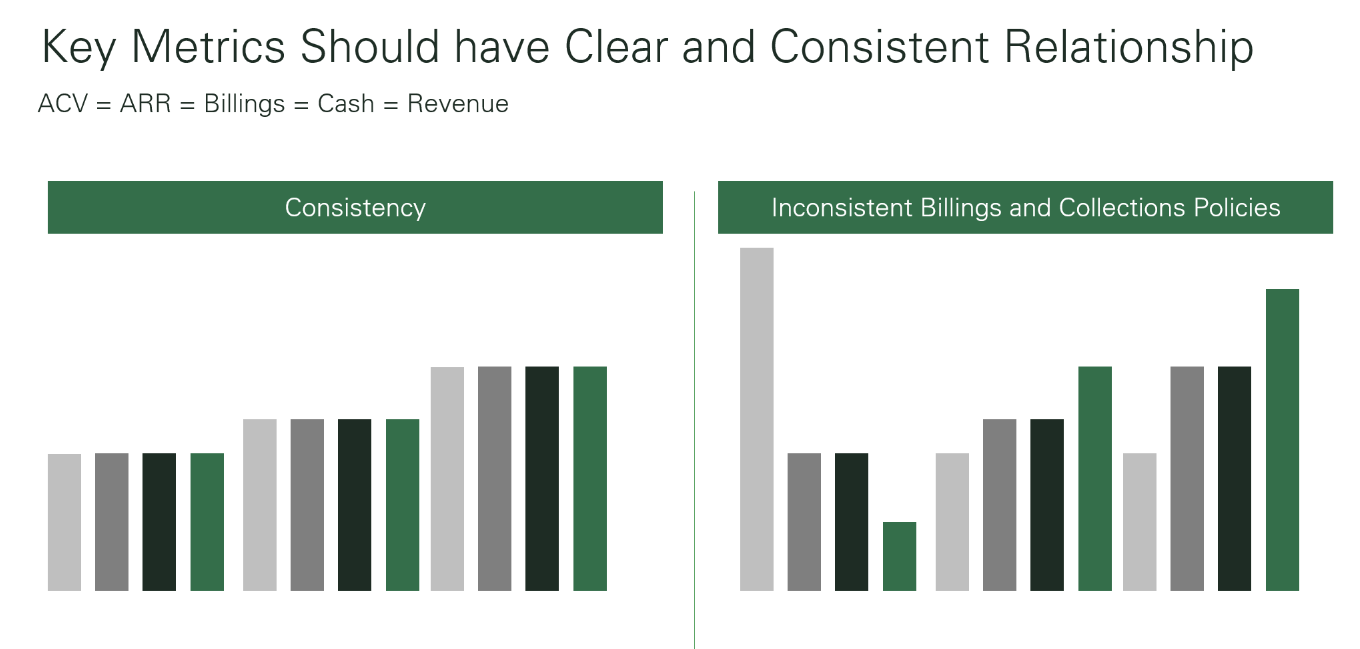
Importance of consistency
The power of the SaaS model is that investors receive multiple GAAP metrics which help frame and quantify the consistency and growth profile of the company.
Namely these are Bookings, Billings, Revenue, and Collections. For every contract a SaaS company sells, all these metrics will eventually be equal. Any sort of deviation is just timing.
When these external metrics all move in unison, investors have greater clarity on the underlying growth of the company which helps derisk their forecast and can help support a higher multiple.
If a company makes operational changes which changes or makes these relationships volatile, the opposite is likely to happen.
Said another way, as soon as investors start talking about billing linearity and rev rec policies instead of growth, you’re screwed (the opposite of what DDOG did at their analyst day)
I presented this chart at our SKO a couple weeks ago which helps visualize what Palo Alto investors started to experience over the past few quarters:
Palo Alto was trading at 13-14x heading into earnings implying investors had high expectations for FUTURE growth.
Check out my analysis on how to tell your growth story:
The changing story and underlying supporting metrics (mainly billings) made investors rapidly discount that the underlying growth was more uncertain before. In Palo Alto’s case it was wither lower industry demand, worse pricing, or “buyer fatigue”.
Net net, this miss and story change caused a rapid multiple contraction to ~10x (which has now partially recovered).
Rising Cost of Money
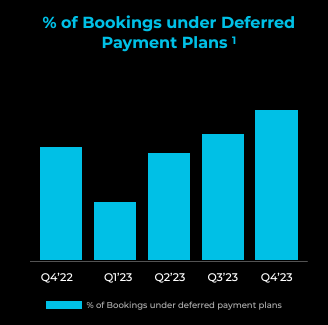
Starting in Q4 FY23, Palo started to discuss customers’ increased desire to have friendlier billings terms than the standard full TCV up front.
These deferred payment terms are delivered in the form of annual billing plans and through our PANFS financing capability. The percent of bookings that included deferred payments increased approximately 45% year-over-year. Additionally, the proportion of our bookings have included billing plans more than doubled from Q3 to Q4. This quarter-to-quarter increase negatively impacted our billings as compared to what we forecasted 90 days ago in our guidance.
A byproduct of the rise in deferred payments is greater predictability of our cash flow over time. For example, we now expect about $1 billion in cash flow from deals entered into in prior years where payments will now come in fiscal year '24. This $1 billion is twice what it was in contribution to our fiscal year '23 cash flow when we entered the year. Summarizing cash flow, I'm confident we can maintain a baseline of 37% free cash flow margins over the next 3 years after accounting for the factors I noted
Lots to untangle here… which I suspect is part of the goal.
But deferred payments is obviously going up. This is defined as companies moving to annual billings (vs. TCV up front) and using PANFS.
In Q1, the company also called out “Volatility in contact duration” as one of the impacts of the companies being more conscious about their billings terms. As a note, bears are saying the company has been using contract duration to keep billings growth strong while using PANFS to finance it.
Financing Receivables
In conjunction with Q4 earnings, Palo started to also disclose the amount of financing receivables on their balance sheet.
The important part to remember about using financing receivables vs. normal deferred billings is it shows up very differently on external billings (a key share price driver and exec payment metric):
Using PANFS allows Palo Alto to continue reporting the full Billings number in external financials, but customers still get the benefit of paying annually.
In normal “deferred payment plans” Palo will just bill a portion of the contract (normally 1-year) then rebill on an annual basis. This again gives customers the benefit of paying annually
Note: all else equal, this either of these mechanisms does not impact Palo’s revenue or “run rate business”
PANFS was heavily pushed in FY23 but that seems to be shifting towards straight annual billings in FY24:
What we can tell is that receivables were generally flat until Q1 FY23
Receivables started to increase rapidly starting in Q2 before peaking, on a dollar value and cash flow impact in Q4, meshing with their overall commentary.
After Q4, it appears customers interest/capacity in using PANFS started to decline as receivables peaked which coincided with billings guidance falling. I would assume because this shows up as a lability on their balance sheet.
Assuming new Financing has stabilized back at prior levels (flattish total receivables), we could expect this to be a considerable cash inflow in 2H FY24 as the first payments of the receivables issues in 2H FY23 come due.
This assumes a 3 year TOTAL average contract length with the first year paid up front and the final 2 years financed with equal payments due over the next 2 years.
High-level I’m calculating a $740M net headwind in FY23 flips to a ~$260M benefit in FY24 and ~$350M benefit in FY25.
Using this methodology, we can also create a proxy for “Collectable” Billings which adjusts reported billings for the net cash impact from financing and allows us to better understand collections potential.
As we can see below Collectable billings was BELOW reported billings in FY23 (creating a cash drag) while this flips in FY24, supporting cash collection vs. reported billings.
Using Collectable billings and adjusting collections by the same amount, we see a high correlation between collections and billings and which more accurately reflects the cash flow trends of the business.
Applying all this to guidance
Applying these collections trends to their guided reported billings estimates + my assumption for financing collectables, I’m getting collections between $9.2-$10B. Again this assumes no increase again in receivables and they don’t see another sudden shift in their billings terms.
Swagging the rest of their cash guidance, it seems like their FCF Margin guidance includes plenty of room for cash expenses. I’m calculating 103%-115% of Non-GAAP expenses (based on guidance) vs. 100-102% in prior periods.
It looks like prior guidance included an even bigger buffer for cash expenses which also explains why they were able to absorb the lower net billings while keeping FCF guidance flat.
This also doesn’t include any beats to EBIT Margins/Expenses, Interest Income, Cash Taxes, and CapEx (which they have a history of also beating).
As usual, please reach out with any comments/feedback (especially negative) or if you’re doing any digging of your own!
With Blessings of Strong NRR,
Thomas
Disclosures (reminder): I do not currently have a position in PANW. None of this is investment advice and is solely my own views. Do you own due diligence.
📢 Cohort #4 Starts Next Week!
If you love diving in SaaS metrics and Palo Alto, you’ll love the interactive workshop! Workshop joins next week and I included a special $100 off below!
Dive into SaaS ARR & revenue metrics (long-term FCF margins, Bookings, billings, and collections)
Co-hosted with Francis (Software Analyst) a guru in Cybersecurity who will help you with frameworks and diving into top public companies
Join students from Goldman Sachs, Microsoft, Bank of America, Palo Alto Networks, Cowen, SVB, Scotiabank, and VCs


Hey Thomas, thanks for putting this together. First half of the article is well-written and clear. Second half not so much.. Lots of changes within the company and I recognise that it's not the easiest to connect all the dots concisely.