☁ How to Build an ARR Book (Part 1)
+ Worksheet to Build your own SaaS "Leaky Bucket"


The ARR book is a cornerstone of SaaS analysis, but few ever really learn how to build from scratch and utilize properly. Many seem to get the general idea, but I’ve received many questions and requests to go through the process in detail.
To help you practice along the way, I built a supplemental and interactive Google Sheet you can use to while you read through the post. Why? Because I need more hobbies 😉
Once you’re done with the post and worksheet, you’ll be able to:
Convert raw contract data to an ARR Book
Allocate all the changes between land, expand, churn, and contraction ARR
Pivot it out to a SaaS “Leaky Bucket”
In part 2, we’ll dive into the many metrics you can calculate off of an ARR Book
👇 Download the worksheet here (at the bottom of the event page)
Check out my other SaaS 101 posts:
📣 NEXT SATURDAY: Free 2-Hour Workshop
If you’re passionate about Cybersecurity and SaaS Modeling, Francis (Software Analyst)and I are hosting a free 2-hour workshop to introduce ourselves and give you an idea what to expect from our full bootcamp:
Intro to Cybersecurity Featuring Palo Alto Networks
Intro to SaaS metrics & ARR Modeling with Datadog
Live Q&A Session & Networking
Saturday, November 18 @ 10am ET
Good opportunity to preview the full, in-depth course we host on Maven (Cohort #3 Starting 11/27).
What is an ARR Book?
An ARR book is a common internal analysis tool as well as a standard due diligence request when VCs and Growth investors are looking to make an investment.
In short, it provides your ARR by customer by period overtime allowing you to calculate key SaaS metrics as well as run analysis on what is working and not working.
Below is a simple example which would allow operators and investors to calculate New, Expand, Contract, and Lost ARR. As well as look at trends by Region and Segment/Customer Size.

What is the Underlying Data? Customer Contracts
ARR is always an output from your customer contract source of truth. These typically originate from Salesforce but may be consolidated and pulled from your primary datalake such as Snowflake and piped into an analytics platform or downloaded for excel.
A customer contract includes all the information required to track customer deliverables as well as additional information which may impact revenue recognition.
This may include:
Customer Name (as well as Unique ID)
Customer Description (Size, Region, Industry)
GTM Descriptions (Customer Segment, Sales Theater)
Product Name (as well as internal roll ups/tags)
Contract Close, Start and End Dates
Size of Contract/ARR

💻 How do I convert contract data to an ARR Book?
Once you have a cleaned dataset (always an herculean effort in itself in early-stage companies), it’s pretty easy:
Make a list of all your logos (rows)
Determine a sequence of periods (months or quarters are most common) you would like to calculate (columns)
Calculate if each logo was generating ARR at the end of any given period
Note: If a logo churns at the end of the period, its typically assumed it’s still in ARR (i.e. 12/31 churn remains counted in December ARR and then reflects $0 in January/the next period)
Boom. Done.
Want to check out the math live? Download it here (link at the bottom of the event page):
The SaaS “Leaky bucket”
The primary output from an ARR book is building a proper ARR Build or Roll Forward, commonly known as the “Leaky Bucket”.
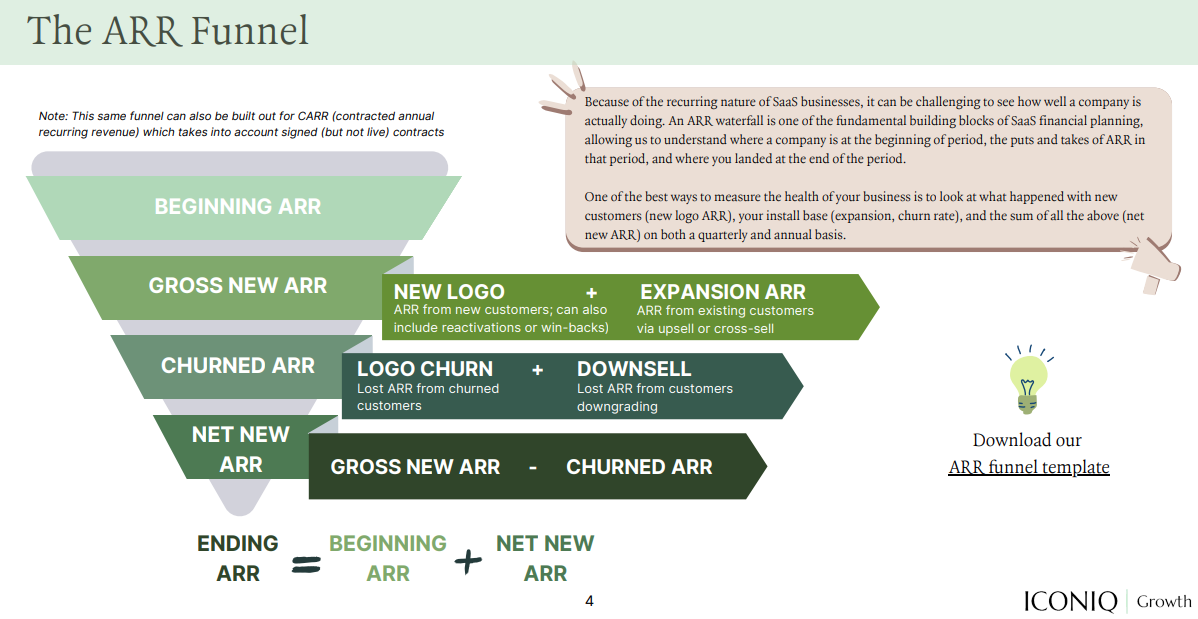
This framework breaks net change in ARR from one period to another into 4 main categories:
New Logo ARR. Driven by new customer growth that the company didn’t have previously.
Expansion ARR. Captures when existing customer add seats, increase usage, or add additional products to their contracts.
Logo Churn. This captures when customer decide to fully end their relationships with the company.
Downsell/Shrinkage. Represents the opposite of expansion ARR. If customer reduce seats, usage or cut products.
ICONIQ provided a visual representation in their SaaS Glossary report:
Why do we break our ARR into these buckets? ARR, and by extension, change in ARR, hides a lot of nuance in business performance. Using the SaaS Leaky bucket allows you to properly compensate results and address issues:
Dave Kellogg provides a good scenario on how different operators in a business would respond to different line items based on their overall responsibilities:

If it’s the VP of New Customer Sales, then very angry. They landed at 60% of plan, not 96%.
If it’s the VP of Sales (responsible for all new ARR), then still pretty angry. They landed at 73% of plan, not 96%.
If it’s the VP of Customer Success (and they’re responsible only for churn), then not angry at all. They were spot on plan though we had a little more shrinkage ARR and a little less lost ARR than plan. Good job, but I have a few questions.
If it’s the CRO, responsible for both new and churn ARR, then back to very angry. Net new ARR (new ARR – churn ARR) was $825K, 60% of plan, not 96%.
In my bootcamp with Francis (Software Analyst), we simplify the concept even further to New + Churn for beginners:

💻 How do I calculate my leaky bucket from an ARR Book?
Once you have a completed ARR book, you must now divide the change in each periods ARR by each logo within the 4 categories described above.
There are MANY ways to skin this cat. The theory behind how you choose to calculate lays in this being a MECE exercise and you must design your spreadsheet/formulas to reflect as such. Everyone will likely do this a bit differently based on what they’re comfortable with and how you like to build your formulas.
Here’s my current favorite:
Add net change columns. I’ve found this intermediate step simplifies some of the formulas below as splitting the categories between net add vs. net negative is an important step. (In the worksheet, I’ve already done this for you).
New Logo ARR. Change = Positive and P0 = 0 (there was no ARR previously)
Expansion ARR. Change = Positive and P0 > 0
Logo Churn. Change = Negative and P1 = 0 (ends with no ARR)
Downsell/Shrinkage. Change = Negative and P1 > 0 (ARR declined, but logo remains)
Once you’ve calculated each of these steps, you can link everything back to the Summary / Leaky Bucket tab.
Hint: Remember adding up all these changes in each period should equal the ending ARR from your ARR book in each period.
Again follow along live (free link at the bottom of the event page):
Watch out for Part 2!
Part 2 will dive into the many different metrics you can use your ARR Book to calculate including:
ASP/Customer economics
Logo bridges
Renewal Rates
GRR/NRR
Contract lengths
☁ Ready to learn more?
3-Week SaaS + Cybersecurity Bootcamp on Starting 11/27
Dive into SaaS ACV vs. ARR, Revenue metrics, Billings, and Bookings
Understand long-term FCF margins
Live Q&A + interactive models/worksheets
Slack networking group
Join students from Goldman Sachs, Microsoft, Bank of America, Palo Alto Networks, Cowen, SVB, Scotiabank, VCs, ETF Managers, and many more!