☁ Digging into SaaS FCF
Moving beyond the GAAP Cash Flow Statement

👋 Happy Labor Day! Trying a new format today. Sticking to some deeper modeling and analysis frameworks and leaving out the market update/commentary. Also trying out Substack. Let me know what you think!
Frameworks & Management Views
Like many operators and investors, I’ve been spending a lot more time on FCF.
Compared to the Income Statement, FCF and the GAAP Cash Flow statement seem much more convoluted and harder to tease out insights and trends.
To make things more difficult, the normal analysis methods used to analyze cash flow simply don’t work or aren’t as insightful when applied to SaaS companies.
This is an overview of a high-level framework that I’ve found helpful to better understand and isolate the key drivers of cash inflows and outflows.
Disclaimer: This was originally developed with internal data. I’ve applied the framework as best as I can to Datadog’s public data throughout the post. I made MANY assumptions that are likely WILDLY incorrect. This post is to show the model and accounting mechanics, not to suggest or comment on anything specific regarding Datadog’s financials, prospects, etc.
How do we turn this into something useful?
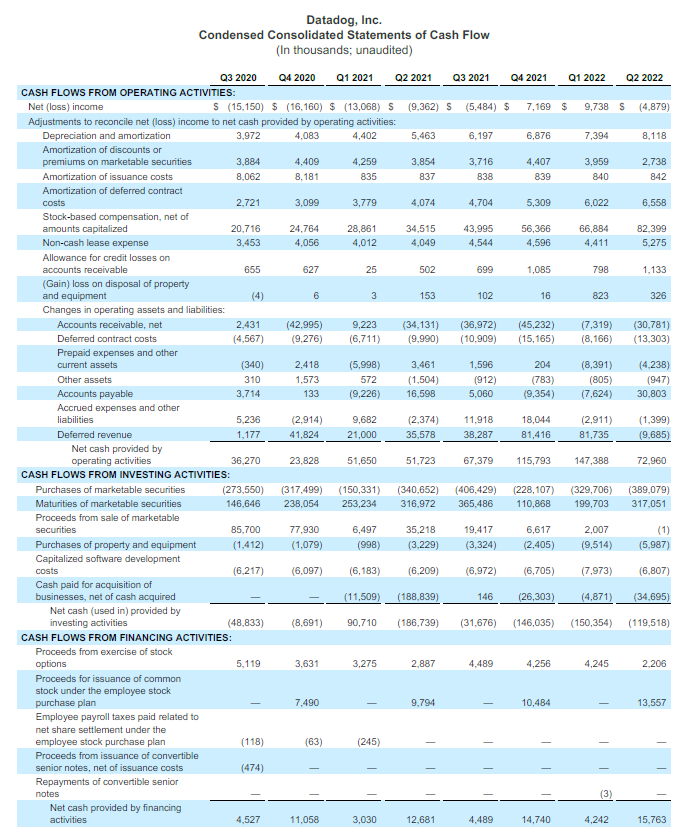
Literally, the only thing most people will recognize here is Net Income.
But I’m a software analyst so I only care about revenue (just kidding, it’s not 2020 anymore)
But what if I want to understand the underlying cash flow generation of the business or if you’re an operator make some decisions on ways to maximize cash flow or understand the normalized trend of your business?
This is when we go from GAAP to Management views.
Cash Flow vs. Free Cash Flow (FCF)
The Cash Flow Statement captures every dollar in and out of the company.
Obviously, every dollar is important, but as an analyst, we want (need) to understand what the normal cash needs of the business are vs. how much it costs to make additional investment decisions (M&A) vs. investments in the company (debt or equity).
Thankfully the OG analysts came up with the FCF metric: Cash Flow from Operations - CapEx - Internal Use SW
Dang, that looks so much cleaner. But still not clean enough
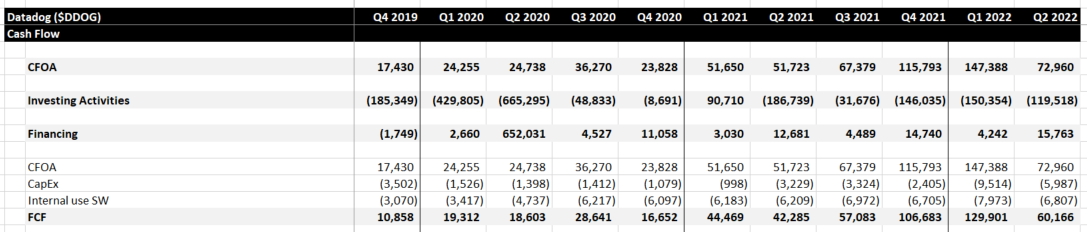
The 2 investing activities are easy: CapEx and Internal Use Software
In a SaaS company, CapEx is largely computers and office build-outs. In manufacturing businesses, it may be new plants and upgrades and within infrastructure companies, it’s typically servers and warehouses.
Internal Use software is when engineering capacity is used to create internal software that will not be marketed, sold, or distributed to customers. This typically includes expenses used to develop the platform used to distribute SaaS to customers and back office systems, such as general ledger or billing modules.
Digging into CFOA is when things get hairy.
Disaggregating CFOA
For those who took intro to finance in college, what are the key differences in SaaS cash flows vs. companies that sell widgets?
Ding ding. 1) Annual upfront billings, 2) no inventories, and 3) its main “suppliers” are its own employees. So most of your typical CCC analysis goes out the window, but that doesn’t mean we can’t look break the Cash Flow statement into other useful parts.
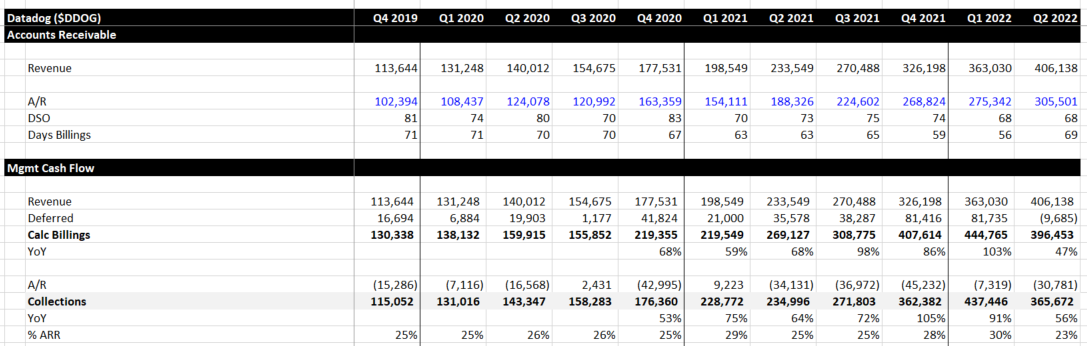
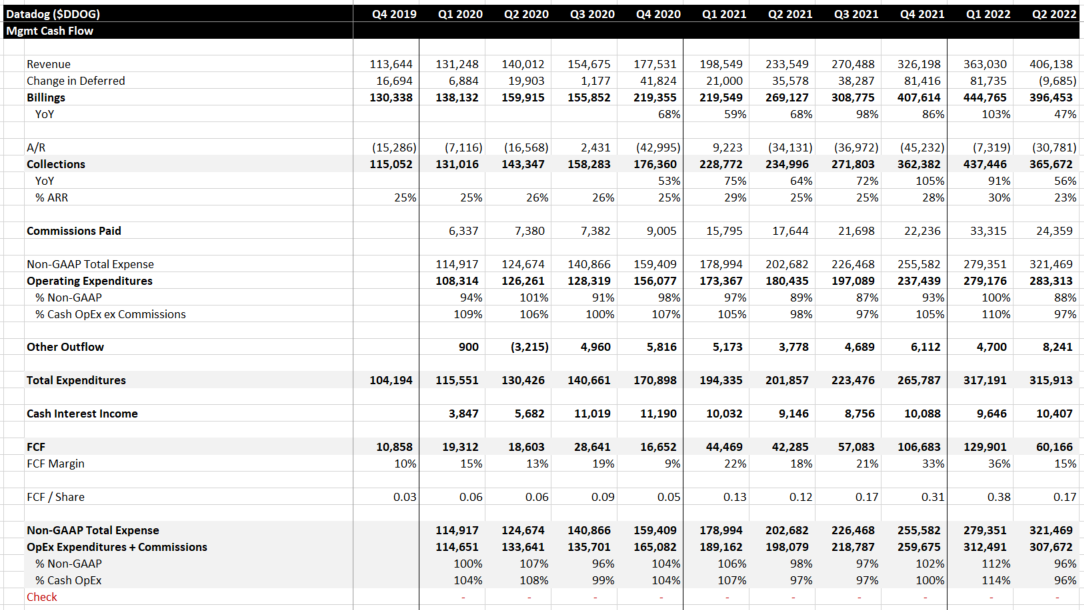
Billings & Collections
The most popular metric quoted by investors, which can significantly impact share price performance, is calculated billings. Which is Revenue + Change in Deferred Revenue. Deferred Revenue tracks when a company bills customers (but has not earned the revenue yet) so you can reverse engineer the metrics to get an idea of future revenue.
I like to take it one step further and throw in change in accounts receivable to get an idea of customer collections in the period. Usually, this is where analysts look at Days Receivable as a methodology to gauge payment terms and collections processes.
A few complications arise for SaaS companies, especially when growing quickly: 1) Customers are billed upfront while revenue is amortized over longer periods, and 2) Sales tend to be back-weighted in periods, especially at the end of the year.
This makes the DSO metric less useful, especially in fast-growing companies and you’ll see a big spike in Q4 due to sales processes more than any change in billing/collections terms.
Note: Datadog uses a lot of monthly billing and usage-based pricing so their financials will not reflect some of these trends to the degree that a company pursuing a pure sales-led, seat-based contract would.
Commissions
Personally, I like to pull out commissions in any analysis I do. This is obviously much easier when working internally as you have perfect information.
Why remove commissions? Overall, they have different key drivers than other expenses and helps remove a lot of period-over-period variability.
Usually a large part of total cash expenditures (20-30% of new ACV), especially in young fast-growing companies
Since a large portion is typically capitalized and amortized, you have to consider a large expense vs. cash delta
They are typically earned in one period and paid in another
Commissions are generally a mess even if you have perfect information. When looking from the outside, the number of assumptions wildly complicates the analysis.
And by wildly complicated, I mean probably useless but it’s fun anyways so we’ll continue.
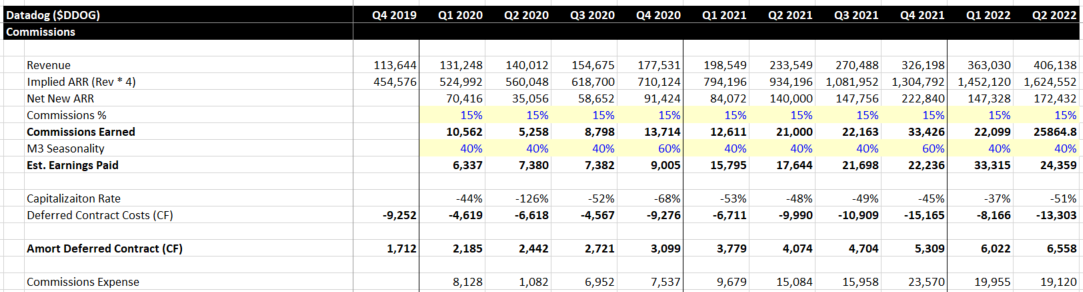
The cash flow statement gives us 2 clues: 1) Deferred Contract Costs and 2) Amortization of Deferred Contracts.
The next step is to calculate commissions earned, paid, and expensed.
To start all this off Datadog also doesn’t provide an ARR metric so we have to calculate our own proxy for most of these calculations.
Commissions Earned: In theory, commissions earned should be relatively straightforward. An account executive closes a deal and is paid a percentage of the contract value. In reality, differences between products, customer types, sales motions, land vs. expand, SPIFFs, accelerators, deal timing, etc. make this metric highly variable and difficult to tease apart.
Commissions Paid: We assume all commissions earned are paid in the following period. To do this, we have to estimate the month 3 seasonality in each period. As discussed, this will be most pronounced in Q4 for most software companies. We will also try to strip this impact out of Accrued Expenses later.
Commissions Expensed. Now that you’ve made 900 assumptions, this part is easy! Commissions Earned - Capitalization + Amortization.
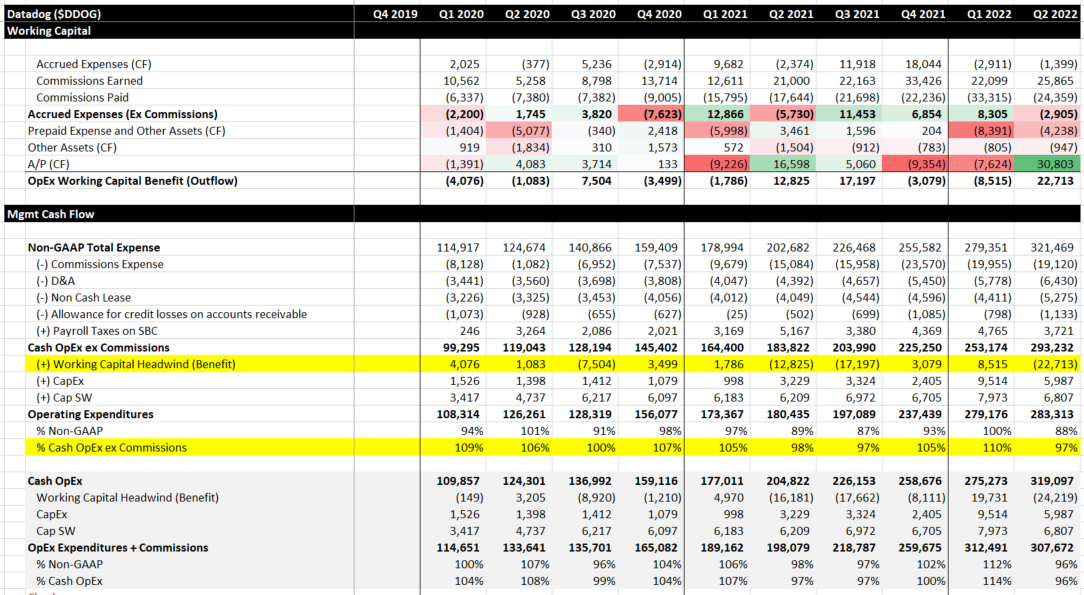
Operating Expenditures
The final piece is determining how much cash must be consumed/invested in the business above and beyond the Non-GAAP Expenses.
This generally includes working capital expenditures, CapEx, and Internal Use Software investments.
Again, this is where the normal Cash Conversion analysis breaks down. SaaS companies don’t have any inventory they must buy and optimize before they can generate revenue and external suppliers make up a relatively small portion of their total cost basis.
So what expenses must be paid ahead and what can be delayed?
Payroll. ~70% of expenses are payroll. It’s pretty simple - your people won’t work if you don’t pay them on time. The only big movement here will be around annual bonus accruals/payments. Yes, people are also compensated with non-cash equity but commissions are generally always cash. Also, note a part of this will flow through as Internal Use Software.
Software & Hosting. Most of these suppliers tend to be mission-critical (you won’t delay paying AWS or your security software) and with the rising spending across the industry, many companies are opting to sign larger upfront contracts to lock in better pricing. In this case, you are usually estimating your future growth which may create a timing mismatch of your cash expenditures vs. collections.
Marketing, Consultants, and Rent. Generally a small part of the overall cost structure. In reality, this is likely the only bucket where you can run a DPO analysis and determine if you can optimize your payments.
To net all these impacts, we look at the working capital impact during the period and can begin to put a story together on how the company is spending its cash.
I like to compare the total Operating Expenditures to Non-GAAP expenses excluding D&A, Commissions, and other Non-Cash items. In the Datadog example, we can see that the company has a cash headwind in Q1 and Q4, but is largely positive in Q2 and Q3.
Is this seasonality “normal” or will it continue? Again it’s very difficult to tease apart the true story/drivers using just external data. Few software companies trade on quarterly FCF results, but FCF margin potential is starting to become a more important metric with investors. This analysis will help you isolate the moving pieces and guide a longer-term FCF margin thesis.
The Management FCF View
Putting all of our pieces together, we can now build a FCF view that better aligns the GAAP cash flow statement to the decisions and actions executives and investors would want to know. Again, if you are dealing with internal information you can also dig a lot deeper and gain even more insights.
Questions that can be answered now:
Do we have a collections issue or an expenditures issue?
Is this related to billing terms, timing, or collections procedures?
How does our FCF change if we have a change in new ACV or commission rates?
How is our budgeting/GAAP expenses impacting our expenditures?
What is driving our quarterly working capital movement? Can/should we address that?
How to improve an internal view:
Get detailed on commissions schedules and expected payout under different ACV targets
Try to separate payroll expenses from non-payroll
80/20 your large contracts to get a better feel for when you’ll have expected cash out the door
Can easily tell that you're not a banker
But very good in details.
Hi Thomas thanks for such insightful work.
I have a few questions so it would be great to hear your thoughts.
1) Commission%
Do SaaS companies offer similar commission% (so your model provides a great way to reconstruct how management look at cash flow), or there are huge different on commission% (so we might better estimate it?)
2) Deferred customer acquisition costs on Balance Sheet.
Does metrics like PRO/deferred customer acquisition cost (or, deferred contract costs) provides some insights on how unit economics looks like in the 'Expansion' phase?
Once again thank you very much for the great work! very helpful!